By Matt Giese, technical services manager, Syngenta, and Paul Koch, Ph.D., University of Wisconsin-Madison
We have all heard the saying, “the times, they are a changin’”. While this is hardly breaking news, most changes tend to be for the better. Flip phone to BlackBerry? Better. Walkman to iPod? Better. Dial-up to Wi-Fi? Definitely better.
Change happens in the turf industry as well. Just last year, the former causal organism of dollar spot, Sclerotinia homeocarpa was renamed to four different species. The most common species on cool season turf in the U.S. was named Clarireedia jacksonii and dollar spot on warm-season turf is generally caused by Clarireedia bennettii. Don’t be fooled, it’s still dollar spot and it will make you look silly if you don’t keep on top of it.
Smith-Kerns dollar spot prediction model
One of the other recent changes with dollar spot is an improved method for determining when it’s going to show up at your course.
Today, the majority of the first spring applications made for dollar spot control are based on a calendar day or some combination of calendar day and weather conditions. Until now, it’s largely been a guessing game. Fortunately, help in the form of new research has arrived.
In 2018, a research paper authored by Damon L. Smith, Ph.D., associate professor and extension specialist at the University of Wisconsin-Madison, and James P. Kerns, Ph.D., associate professor and extension specialist at NC State University, described a weather-based warning system on when to make fungicide applications to control dollar spot on turfgrass. They tracked dollar spot symptoms over a six-year period at six different turf research locations across the U.S. and found that relative humidity and average daily air temperature were the most predictive conditions for disease development. Using this data, a moving five-day average was inserted into a logistic regression equation and the Smith-Kerns Dollar Spot Prediction Model was born.
The key difference between the Smith-Kerns model and previous dollar spot models is that the model does not tell a user when to spray, it makes predictions of dollar spot occurrences. Previous models tended to over- or underestimate risk and this model provides improved accuracy for maximizing dollar spot control. Based on research done in Wisconsin with creeping bentgrass, fungicide applications made when dollar spot probability would exceed 20 percent, tended to be the best benchmark for providing effective disease suppression. It’s entirely possible, and even likely, that different benchmarks higher or lower than 20 percent will be more effective at your course depending on your grass type, soil type, and various management practices. For our purposes here, we’ll use the 20 percent probability as our benchmark.
Know your threshold. Protect your course
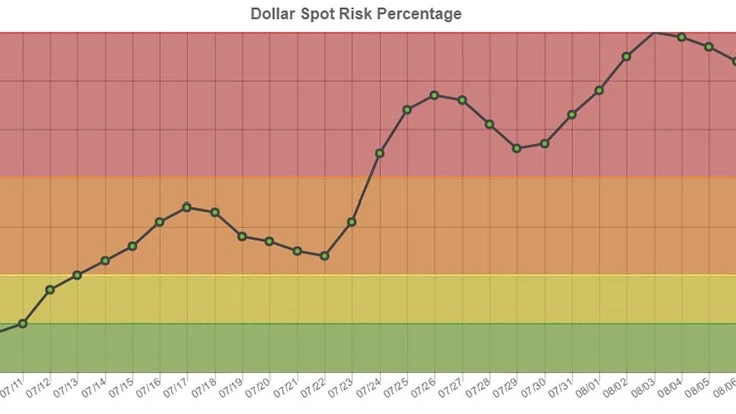
The way the model can be used, once we’ve established a threshold of 20 percent, is to watch when the model output crosses the threshold. Once the output exceeds the threshold, this is the indicator to apply a fungicide. If we apply a 28-day interval fungicide, we don’t put too much stock in the model output during this time since the fungicide should be controlling the disease. After that interval expires, we again watch the model output for when it rises above the 20 percent threshold and then make a subsequent application. You’ll notice a gap between the first and second applications that exceeds the 28-day interval in our example provided in Figure 1.

Figure 1. An example showing how the Smith-Kerns dollar spot prediction model can be implemented.
Because the model output changed with the weather patterns, an application wasn’t necessary at the expiration of the 28-day interval, but rather a few days later when the model output exceeded the threshold. This process is repeated throughout the season until the risk for dollar spot subsides in the fall.
Research conducted at Wisconsin found that spring and fall were the two seasons where the model was most beneficial for eliminating unnecessary fungicide applications. Additional applications and uses of the model are currently being researched at Wisconsin and elsewhere and might bring added benefits in future years.
How can you apply this strategy at your golf course?
Fortunately, the hard part has already been done. Syngenta has incorporated the Smith-Kerns model and local weather data for each zip code into a user friendly format that allows you to plug in your zip code and email address and have an alert sent directly to you. You select your spray interval (7, 14, 21, or 28 days) and which day of the week to be notified. It’s as simple as that. The alert also provides a risk index for the past 25 days and predicts risk for the next five days based on your weather forecast. The website also has the capability to select historical risk from a custom defined date range, so you can look back in time and view the dollar spot risk for your area. Additional Smith-Kerns Model resources can be found at the Smith-Kerns Model webpage, the GreenKeeper website, and the GDDTracker website.
The beauty of this model for predicting dollar spot risk is that you only make applications when you need them, not because the calendar says so. With the same products, and the same rates, you can increase your control without increasing the amount of product used. Who knows, it might even save you a fungicide application or two this season.
See, change is good.
Matt Giese is technical services manager at Syngenta. Paul Koch, Ph.D., is an assistant professor of plant pathology at the University of Wisconsin-Madison and an expert in urban ecology and turfgrass management.
Latest from Golf Course Industry
- From the publisher’s pen: Conscientious of a bigger role
- Bernhard and Company partners with Laguna Golf Phuket
- Terre Blanche showcases environmental stewardship
- VIDEO: Introducing our December issue
- Bernhard and Company introduces Soil Scout
- Nu-Pipe donates to GCSAA Foundation’s Centennial Campaign
- GCSAA enhances golf course BMP tool
- Melrose leadership programs sending 18 to 2026 GCSAA Conference and Trade Show


